Get to know your Blue Odin store dashboard
The dashboard gives you a bird’s eye of your WooCommerce store’s metrics so you can see how your business is doing.
It’s the first thing you see when you log in to Blue Odin.
Here’s what you’ll learn in this help article:
- The difference between a single store dashboard and a global view dashboard
- How to clone and customize your dashboard
- The different types of widgets you can add to the dashboard
- How to add or remove widgets from the dashboard
Table of Contents
- Get to know your Blue Odin store dashboard
- Single store vs global dashboard
- How to clone your Blue Odin dashboard
- The date / date range selector
- The Blue Odin Widgets
- MORE WIDGETS! How to add or remove dashboard widgets
Single store vs global dashboard
You can choose between a single store dashboard or a global dashboard.
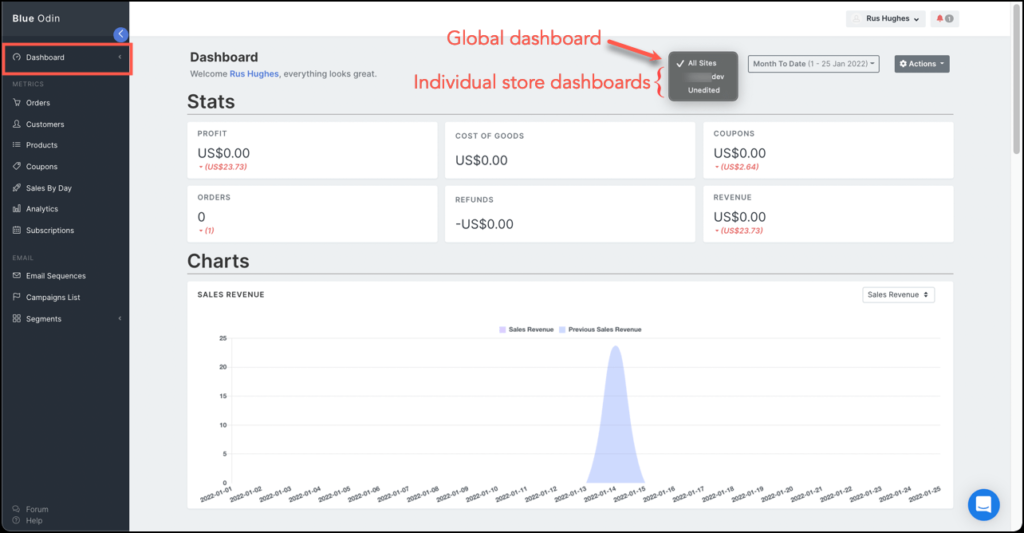
What’s the single store dashboard?
The single store dashboard shows the metrics for a single WooCommerce store.
In the example above, the dashboard being displayed is for UNEDITED.
If you have more than one WooCommerce store and you want a dedicated dashboard for each, you can simply CLONE your dashboard for easy access (see instructions below).
What’s the global dashboard?
The global dashboard lets you see the aggregate total of all your stores’ metrics.
To view this dashboard, select ALL SITES from the store selector dropdown (see screenshot above).
How to clone your Blue Odin dashboard
If you have more than one store imported to Blue Odin and you’d like to have a dedicated dashboard for EACH store, then you can clone your dashboard.
Here’s how:
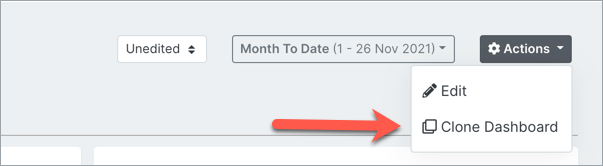
You will then see the cloned dashboard on the menu for easy, one-click access!
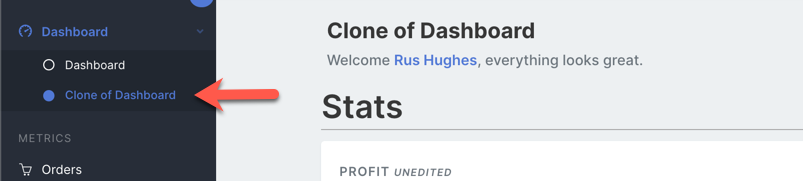
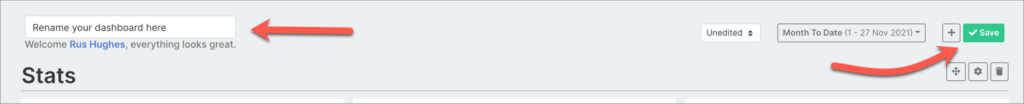
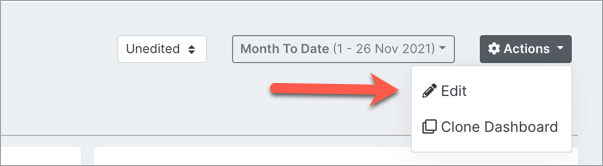
To rename the dashboard, click on Actions > Edit and enter the new name.
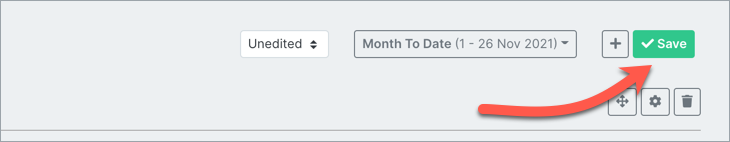
Then click the green Save button.
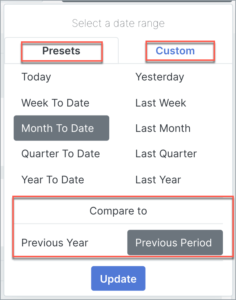
The date / date range selector
All data displayed in the widgets depend on the date range selected.
The default period is Month To Date, but you can choose from Preset or Custom date ranges.
You can also Compare the data for your selected period to the previous year or previous period.
The Blue Odin Widgets
Blue Odin gives you full control over your dashboard.
You can re-arrange the various metrics and add/remove widgets as necessary.
Let’s go through the list of DEFAULT (but completely editable) WIDGETS.
Default Section #1: Stats
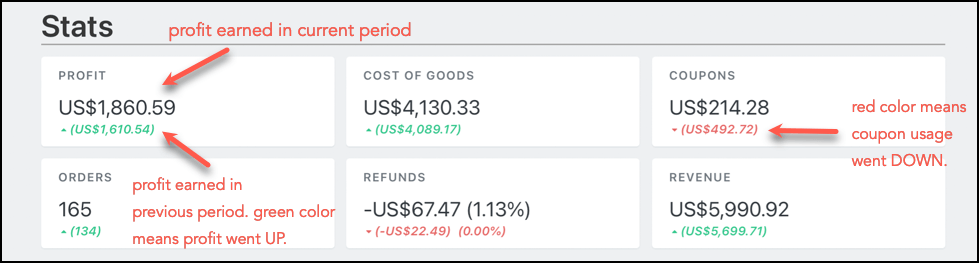
In the Stats section, you can quickly see all the most important KPIs and metrics of your store(s) in one glance with the following pre-added widgets:
- Profit
- Cost of goods
- Coupons
- Orders
- Refunds
- Revenue
The stats widgets are also color-coded:
- Green means that particular metric went up compared to the previous period.
- Red means that metric went down compared to the previous period.
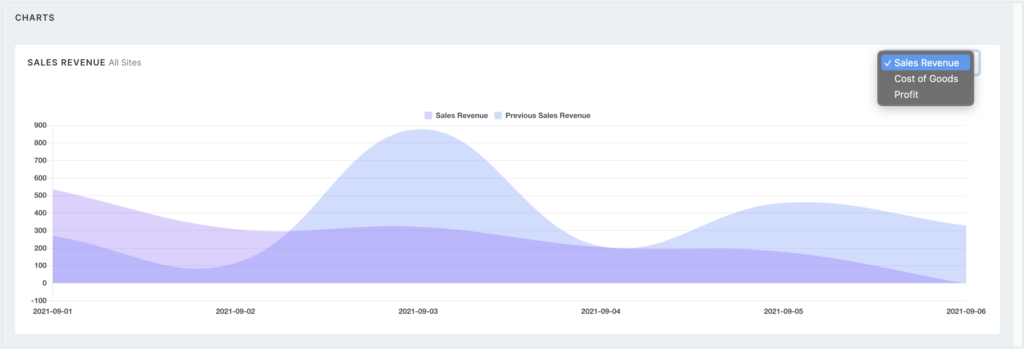
Default Section #2: Charts
In this widget, you can view the charts of all your stores’ Sales Revenue, Cost of Goods, and Profit from your selected period compared to the previous period.
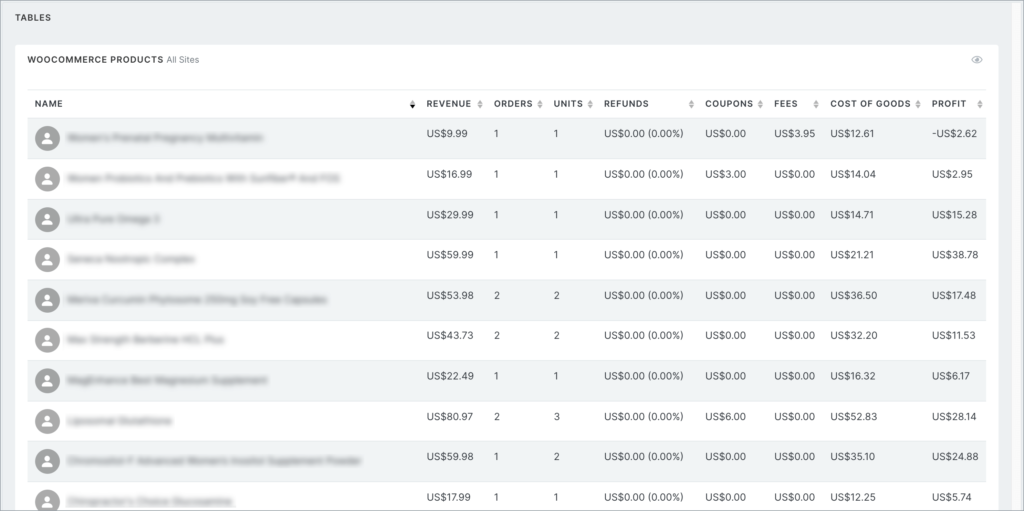
Default Section #3: Tables
This section displays the list of PRODUCTS SOLD during the date / date range you’ve selected.
This is especially useful if you sell multiple products in your stores.
The columns display the following information:
- Product name
- Revenue
- Orders
- Units
- Refunds
- Coupons
- Fees
- Cost of Goods
- Profit
You can easily sort the table by column, too.
MORE WIDGETS! How to add or remove dashboard widgets
You have complete freedom over the widgets in your Blue Odin dashboard.
Click this link for a complete list of available widgets.
To add or remove widgets, click on Actions > Edit.
Click on the + button:

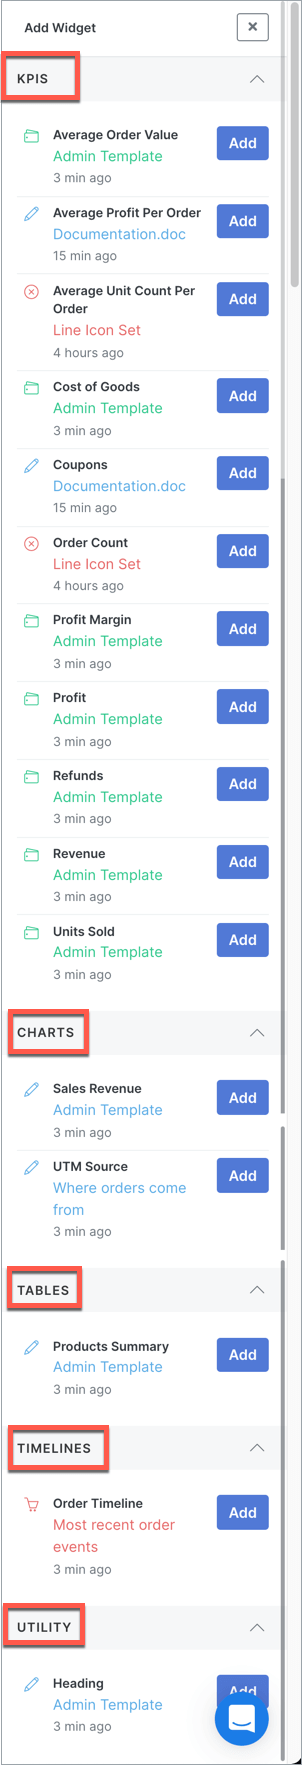
Then select your widgets from the menu by clicking on the blue Add button.
The widgets are categorized into:
- KPIs
- Charts
- Tables
- Timelines
- Utility
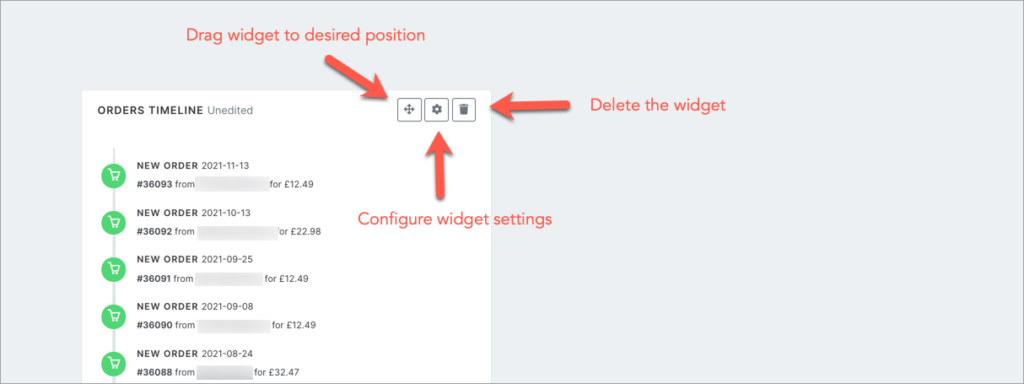
Here’s what you can do with the widgets:
- Drag them to your desired position on the dashboard
- Configure the widget settings
- Delete the widget
Hit the green Save button to apply all changes made.
That’s it! Feel free to customize your dashboard!