The Blue Odin dashboard displays the key metrics that give you deep insights into how your WooCommerce business is doing.
There are 3 default sections – Stats, Charts, and Tables.
In the Stats section, you will see these default widgets:
- Profit
- Cost of Goods
- Coupons
- Orders
- Refunds
- Revenue
In the Charts section, you will see the Sales Revenue chart.
In the Tables section, you will see a widget of WooCommerce products sold within the specified period.
Table of Contents
- The Complete List of Blue Odin Widgets
- Widget category #1: KPIs
- Widget category #2: Charts
- Widget category #3: Tables
- Widget category #4: Timelines
- Widget category #5: Utility
Before we go through all the widgets, here’s how you add/remove them from your dashboard:
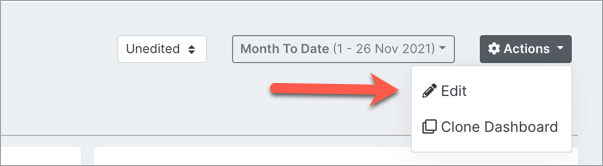
Click on Actions > Edit:
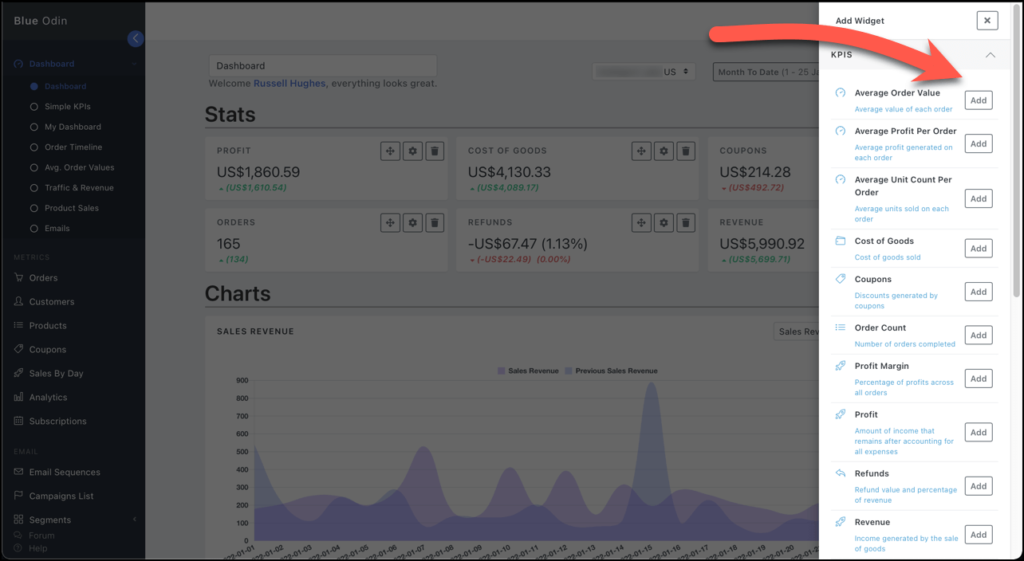
Click on the + button:

Then select from the list of available widgets that will appear on the right side of the page and click on the Add button.
The Complete List of Blue Odin Widgets
Our widgets are categorized into 5 categories, these are:
- KPIs
- Charts
- Tables
- Timelines
- Utility
Let’s go through each category below!
Widget category #1: KPIs
1) Average order value
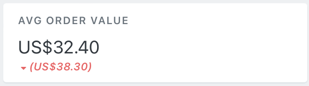
This widget displays the average order value (AOV) per customer within the selected period.
For example, if you selected Month to Date in the date range selector, and the AOV is $32.40, then it means that, on average, each customer is spending this amount per order.
The value in parenthesis ($38.30) is the previous period’s AOV, meaning, in this particular case, the AOV went down by $5.90.
2) Average profit per order
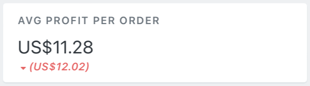
This widget shows how much profit your store makes per order for the selected period.
In the screenshot above, we can see that the average profit per order went down from $12.02 to $11.28.
3) Average unit count per order
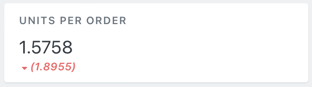
This widget keeps track of the number of units purchased per order.
In the screenshot above, we can see that the number of units per order went down from 1.8955 to 1.5758.
4) Cost of goods (default widget)
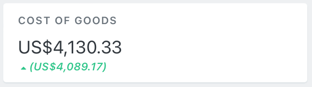
This widget displays the total cost of goods sold for the selected period.
For this example, the cost of goods sold shows an increase over the previous period.
5) Coupons (default widget)
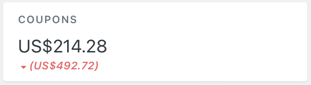
The coupons widget displays the total amount of coupons used/redeemed for the selected period.
In the screenshot above, you can see that the coupon amount redeemed in the current period was much lower than the previous period.
6) Order count (default widget)
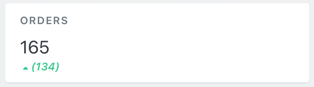
This widget displays the total number of orders made in your store within the specified period.
In the example above, there is a substantial increase in the number of orders from 134 to 165 when compared to the previous period.
7) Profit margin
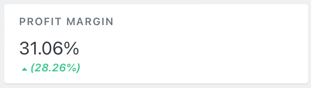
This widget displays your WooCommerce store’s profit margin, a.k.a. how profitable your store is.
This widget lets you see at a glance whether you’re hitting your target profit margin – and actually making money in your business.
Knowing your profit margin helps you understand whether you need to reduce costs or raise your prices.
8) Profit (default widget)
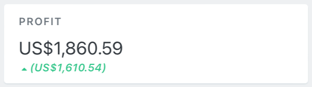
As a business, it’s important to keep track of how much profit your store is making.
So, we made sure the profit widget is the very first thing you see in your default Blue Odin dashboard (which you can edit if you want to).
9) Refunds (default widget)
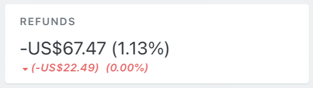
The refunds widget displays the total amount refunded in the time period selected.
The widget displays the data in both dollar amount and percentage.
10) Revenue (default widget)
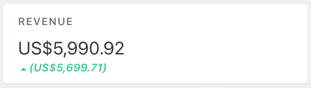
This widget displays the total amount of revenue earned during the date or date range selected.
As you can see in the screenshot above, the revenue for our sample WooCommerce store has almost doubled compared to the previous period!
11) Units sold
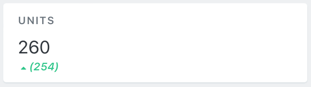
This widget displays the total number of units/products moved or sold during the selected period.
Widget category #2: Charts
1) Sales revenue (default widget)
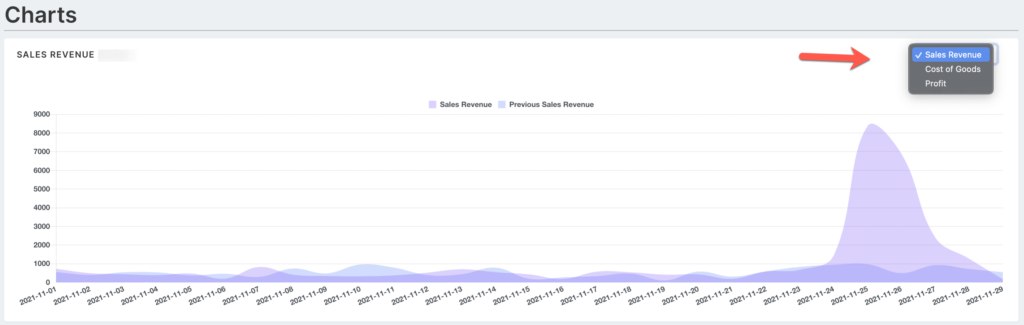
The sales revenue widget shows the revenue your store has made for the selected period vs the previous period.
As you can see in the screenshot, there is a massive difference between the current period’s sales revenue vs the previous period. The chart makes it easy for you to see how your sales campaigns are doing.
You can also view the charts for Cost of Goods and Profit, just select these options from the drop-down.
2) UTM source
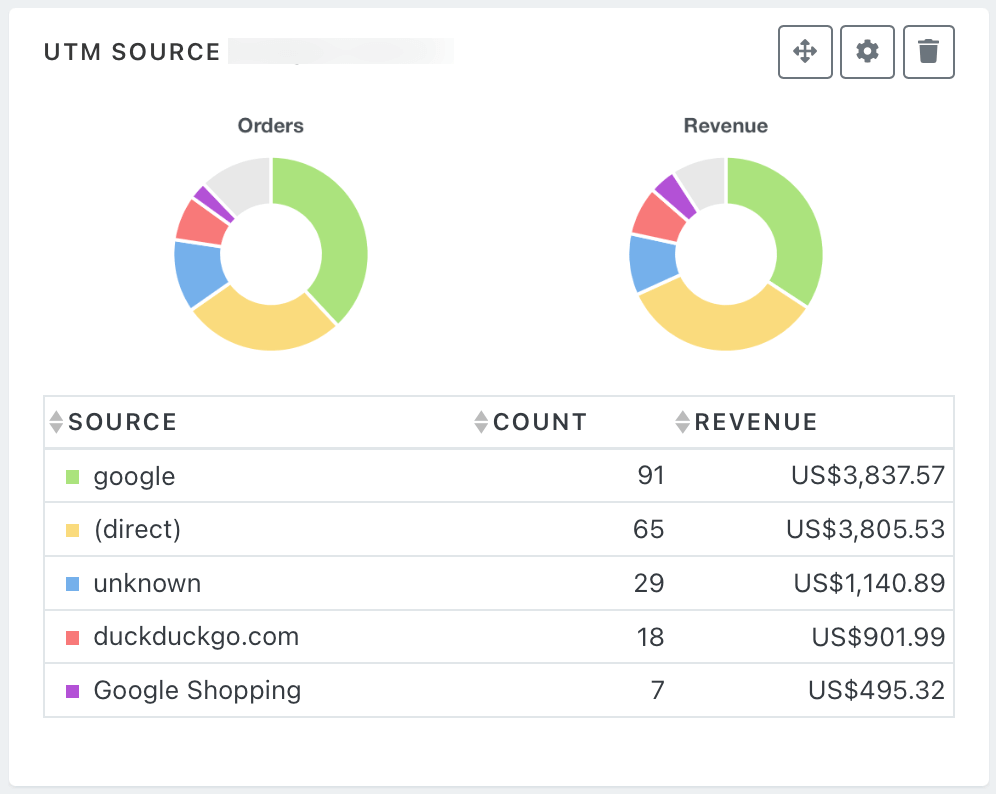
This widget shows you where your store’s orders are coming from, courtesy of UTM tracking codes. The chart also displays the number of units purchased and total revenue per channel.
As you can see in the screenshot above, Google and direct traffic are the top 2 sources of revenue for our example WooCommerce store.
Widget category #3: Tables
Products summary (default widget)
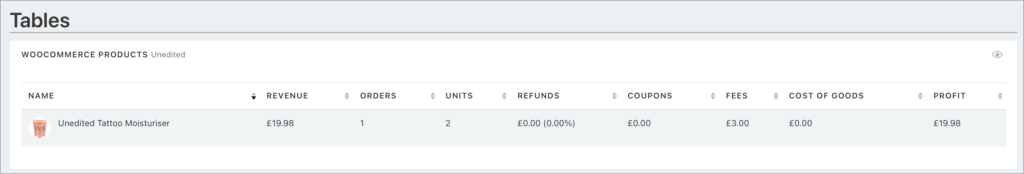
The products table widget lists down the products that have been sold within the selected period.
This widget shows the revenue, the number of orders and units sold, refunds made, coupons used, fees, cost of goods, and profit.
Widget category #4: Timelines
Order timeline widget
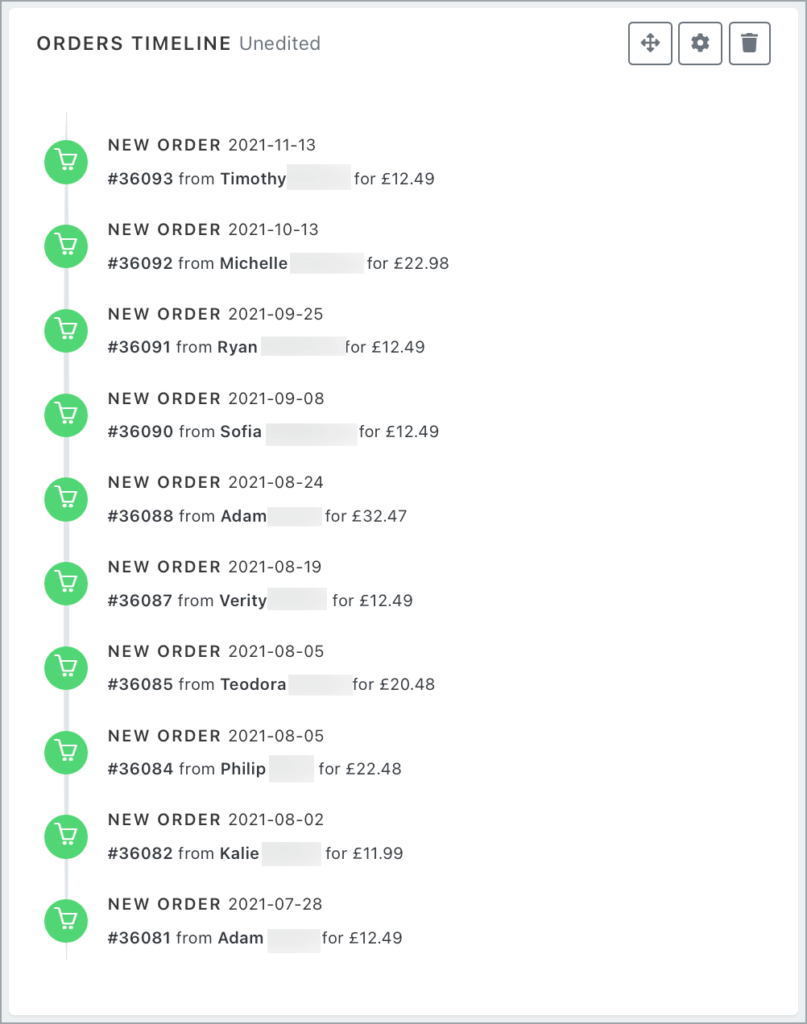
This widget shows the 10 most recent orders made in your store.
It displays the customer’s name, date, order number, and amount paid.
If you’re keeping an eye on a particular customer, add this widget to your dashboard.
Widget category #5: Utility
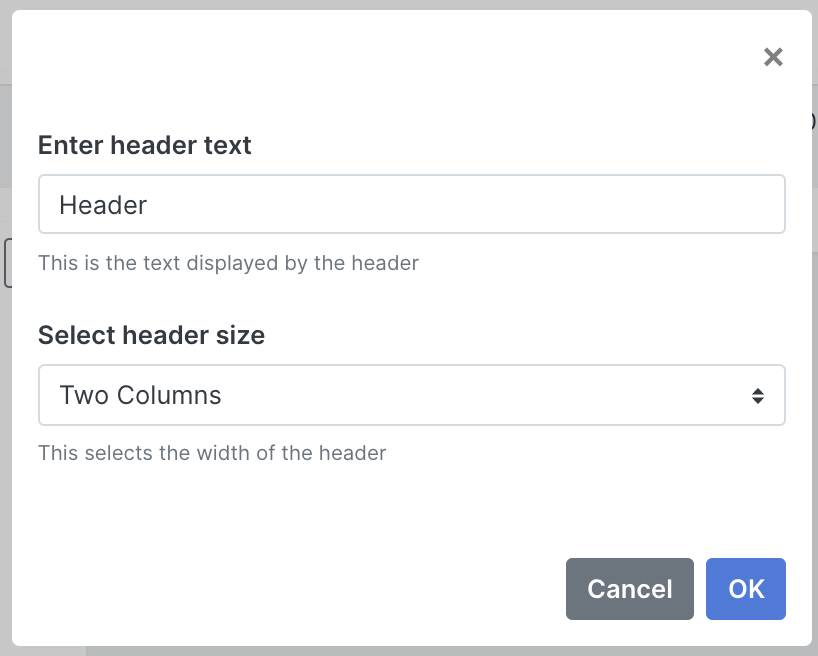
Header widget

The default headers in Blue Odin are Stats, Charts, and Tables. If you’d like to add more, just add a header widget.
To change the header name and adjust the number of columns, click on the gear icon to configure the widget settings. Click OK to save your changes.