Ecommerce dashboards look pretty cool, don’t they? Complex data is simplified into visually appealing graphs, charts, and tables, helping managers and CEOs take their business to the next level.
There’s no shortage of ecommerce dashboards to choose from. To begin with, your ecommerce platform of choice (e.g. Shopify, WooCommerce) most likely has a basic built-in dashboard. If you don’t want to use the default dashboard, you’ll find plenty of third-party options on the web, too.
But is it worth it setting up a dashboard for your ecommerce store? And how exactly can an ecommerce dashboard help your business? Also, what kind of metrics should you add to your dashboard? Scroll down as we answer these important questions – and more – in this blog post!
What is an ecommerce dashboard?
In the ecommerce world, data is king. An ecommerce dashboard is simply a set of metrics – usually in chart/graphical format – that gives the user at-a-glance views of key performance indicators or KPIs. In short, it gives you a bird’s eye view of how your business is doing.
So, instead of a long list of raw data, an ecommerce dashboard simplifies it all for you. You have the most important KPIs at your fingertips, helping you identify problem areas, optimizing sales and revenue, and more.
A typical dashboard can be customized to suit your needs. For example, you can add or remove the metrics you want to appear in your dashboard to allow you to make business decisions quickly.
If you’ve added an inventory KPI to the dashboard, you can see right away when stocks are running low so you can order additional merchandise from suppliers. If you’re keeping track of your profit margins, and you notice you’re not making as much money as you thought you were, you can quickly adjust your prices or perhaps re-do your marketing strategy.
Think of an ecommerce dashboard as THE place to look at if you want to know how your business is doing. It gives you a snapshot of your store’s overall performance, so you can make the necessary adjustments to your goals and/or strategies.
Here’s a screenshot of Blue Odin’s default ecommerce dashboard:
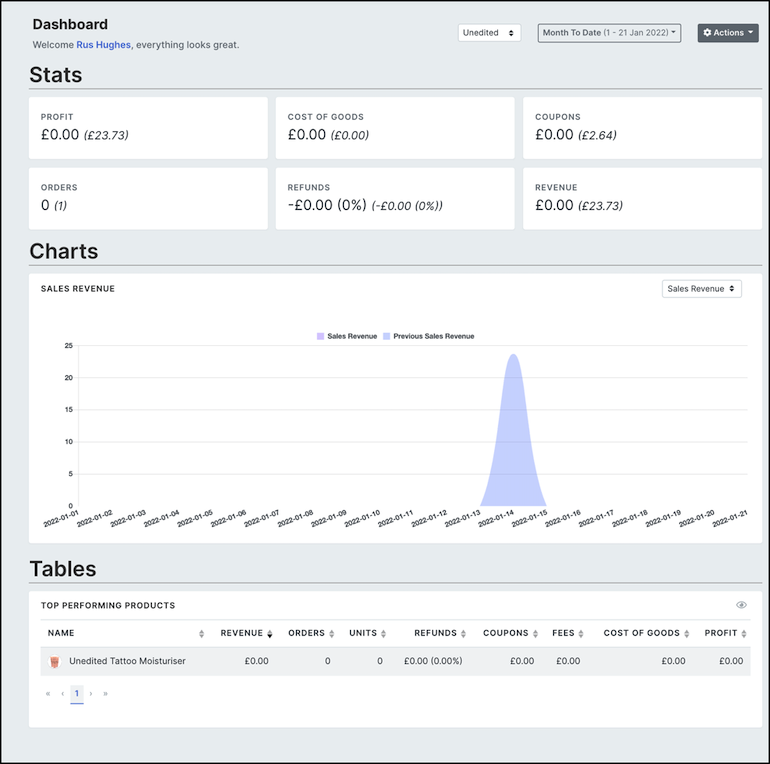
The whole dashboard is customizable, so you can add KPI widgets that are most relevant to your business. You can re-arrange the widgets too, so you can easily locate the KPIs you want to look at first when you login to Blue Odin.
To know more about the Blue Odin dashboard, take our ecommerce dashboard tour here.
How an ecommerce metrics dashboard can help your business
Understanding customer behavior is key to optimizing your store’s profit and sales. By adding the right KPIs or metrics to your dashboard, you can quickly see how well your campaigns are doing – and your ecommerce business as a whole.
Here are some benefits of using an ecommerce dashboard:
- Gives you a clear overview of important metrics so you can identify and fix issues
- Make key metrics visible so you can monitor the performance of your business, e.g. are you profitable or not, are you hitting your daily/weekly/monthly goals, etc.
- Improve marketing strategies so you can hit all of your targets
- Hide data irrelevant to your current goals so you don’t waste time on the non-essentials
- Make reporting simple and easy to understand, especially when presenting to stakeholders
- Get real-time updates so your decisions are based on latest information
- Encourage repeat purchase and increase customer lifetime value
- Allocate company resources to tasks and activities that will help you reach your goals
What are examples of important ecommerce KPIs to add to your dashboard?
Not all ecommerce dashboards work the same way. Here are examples of ecommerce KPIs you may want to add to your dashboard (all of these KPIs are available in Blue Odin):
- Average order value – average value of each order
- Average profit per order – average profit generated on each order
- Average unit count per order – average units sold on each order
- Cost of goods – cost of goods sold
- Coupons – discounts generated by coupons
- Order count – number of orders completed
- Profit margin – percentage of profits across all orders
- Profit – amount of income that remains after accounting for all expenses
- Refunds – refund value and percentage of revenue
- Revenue – income generated by the sale of goods
- Units sold – individual units sold across all orders
Now, if you’re wondering which metrics you should add to your dashboard, the answer is it will depend on your goal(s).
The first thing you need to identify is your goal. Then you can figure out the associated KPIs that you can track on your dashboard.
Let’s say, for example, you want to run a sales campaign for your upcoming product launch. You’re aiming to make at least $1000 in profit (not just sales) over the next 30 days. Here are some example KPIs you can add to your dashboard:
- Order count
- Profit
- Revenue
- Cost of goods
- Units sold
Additionally, the coupons KPI may also be helpful if you use special coupons for each marketing channel used in your campaign.
For a complete list of KPI widgets available in Blue Odin, please click here.
How many metrics should you track in your ecommerce dashboard?
There really is no single best answer to this question, reason being that each business is different, and every team member needs access to different metrics to complete assigned tasks.
However, just like with other types of dashboards, less is more. The more crowded the dashboard, the more confusing it gets. Fortunately, most ecommerce dashboards can be customized to fit your needs.
For example, if you only wish to see metrics related to website traffic, then you can remove customer-service related metrics. Or if you’re not interested in seeing data concerning stocks and inventory, then you can remove those as well.
Likewise, a supplement brand selling products all over the world may want to see a different set of metrics than an online business that sells downloadable courses.
If you’re on the hunt for the right dashboard for your business, make sure it tracks the right kinds of metrics relevant to your targets and goals.
Conclusion
Ecommerce dashboards can help you run your business more efficiently. By paying attention only to the most important metrics, you can streamline your business processes so you can monitor and watch your store grow.
Own a WooCommerce store(s)? Click here to import your WooCommerce data to Blue Odin and get deep insights into your store’s performance!